We know everything you’re doing, and when you’re doing it…

A few months ago, I wrote about an experiment I conducted where I tracked how often our users were clicking on the date picker buttons in our reporting platform.  The results to this experiment were so profound that they led to a significant change in our product.  Since then, I have become fascinated with the idea of tracking usage statistics within our products.

Over the past two months, I have built a full-featured product analytics tool that tracks every single thing that a user is doing when logged in to our platform, when they are doing it, and even how long it takes them to do it.  Here is a screenshot of what that data looks like on our end:

pa-activity

As you can see that this data is organized onto a timeline where the date range can be adjusted.  There are four categories, each of which is expandable. These categories are Configuration, Lead Box, Reports, and General.  In the screenshot, you can see that I have expanded the Configuration category, so that I can view when users in this account have set up automated reports, tracking lines, staff, and users.  I have also expanded the Reports category, so that I can view when users are actively viewing each specific report, and for how long.  If the user’s mouse stops moving for two minutes, we stop tracking data until their mouse moves again.  If I want to view data for a single specific user, I can select an individual user from the dropdown in the top right.  Lastly, I can hover over each data point for more detailed information.

All of this new data will be critical in shaping the future of our product development, as well as the manner in which our consultants train our users to use our products.

To take things a step further, we recognized that there are certain one-time events and actions that are critical to the progression of each user’s understanding of our product.  By tracking these events, we can identify the next steps required to ensure that each user is getting the maximum value out of our product.  Here is an example of what that data looks like on our end:

pa-events

You can see that there are four types of events – Critical Events, Secondary Events, AC Events, and Support Cases.  There are only about six Critical Events in total, and these events are the steps required for a brand new user to get to the WOW moment within our product (the moment that they realize how awesome and valuable our product is).  You can see in the screenshot that I am hovering over the second Critical Event – “provisioned first line”.  Behind Critical Events are Secondary Events.  There are many more Secondary Events than Critical Events, and while these are important, they aren’t quite as urgent for our consultants’ attention.  And that brings me to AC Events.  Our Associate Consultants (ACs) spend most of their time reaching out to our clients, training on our products and ensuring that each customer is receiving maximum value.  And lastly, we log when a support case has been created in association with this account.

Altogether, this event timeline paints a great picture of the lifespan and progression of every single one of our clients.  You can be sure that in the coming months, there will be some great changes coming to our product as a result of this new data that we have just begin tracking.


Usability: Designing with Data

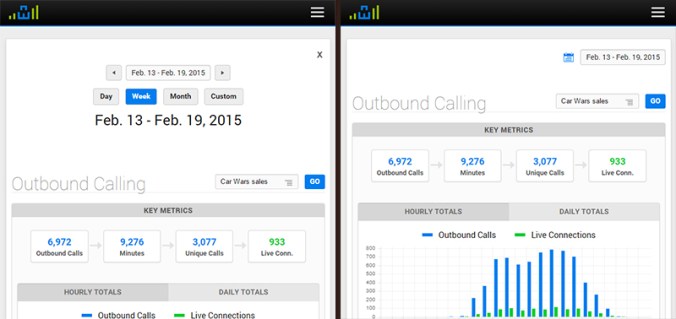
Last summer, I added a fancy date picker to the top of all of CI’s major reports. This date picker included buttons to quickly access data for a variety of date ranges. This feature enhanced the usability of our software, but we recently realized a problem – the date picker was taking up too much vertical space on the top of the page, pushing each report’s meaningful data down and out of view when the page loads. To remedy this problem, we have collapsed the date picker behind an expandable button – which bumps up the meat of the report upwards a good 150 pixels when the page loads.

date_picker

This was a quick change that was really just a solution to a longstanding (and rational) complaint from our CEO about the date picker being too big. But before making this change, I wanted to track the impact the change would have on our users, so I built an analytics script that tracked how often each button was being clicked within the date picker on a report-by-report basis.

After a week of data collection, I noticed a very curious trend. Of the thirty or so unique reports that we have across our various platforms, nearly 80% of all report views were for the Outbound Activity report. The Outbound Activity report is a useful report, but is certainly not one of our flagship reports.

Even more interesting, of the people who accessed the Outbound Activity report, 65% clicked the “Day” button on the date picker (which shows yesterday’s data), and 82% clicked the “Next Range” button.

I was at baffled by this data. Why are our users so obsessed with the Outbound Activity report? Why are they clicking the “Day” and “Next Range” buttons so often?

After a discussion with one of our consultants, the answer became blindingly obvious. The vast majority of our users use this Outbound Activity report to monitor their live outbound calling activity on a per-staff member basis, ensuring that everyone is meeting their daily OB call quotas.

Not having known this, we still had the default date range for this Outbound Activity report set to the previous week. Thus, our users were (apparently every hour or so) having to load the OB report, then click “Day” to load yesterday’s data, then click “Next Range” to load today’s data. Convoluted by the fact that the date picker was about to be collapsed behind a button, I realized that the process for accessing live outbound call data in our product was not at all easy. In fact, it really sucked.

Solving this problem was as simple as adjusting the OB Activity report’s date range to default to today’s date. The real challenge in the scenario was identifying that there was a problem in the first place, and this would never have happened had I not built an analytics script to gather data on our users’ behavior.

This experiment has undoubtedly inspired me to integrate user data collection into future design decisions. Improving usability always starts with understanding the user, and I look forward to using data collection to supplement my own intuition in my journey to get inside the minds of our users.

Functional. Reliable. Usable. Delightful.

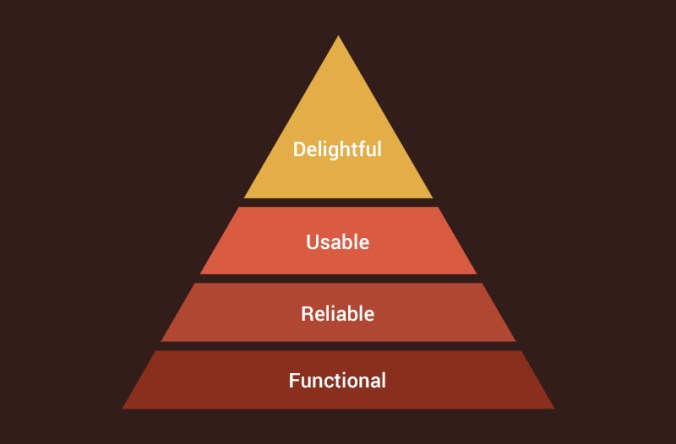
Aarron Walter, MailChimp’s user experience design lead, has developed an insightful model for what goes in to creating great software. Clearly a reskinning of the famed Maslow’s hierarchy of needs, Walter’s pyramid (as seen below) is a representation of the four basic user needs that must be considered when building software.

pyramid

During my architectural studies at Texas A&M, we didn’t spend much time discussing pyramid construction, but I’m fairly sure that if the lower tiers are weak, the top tiers will crumble. That said, here is a quick breakdown of Walter’s model:

  1. Functional – Above all, software has to actually function. A button titled “Outbound Activity” must actually load a report that displays outbound calling data.
  2. Reliable – A user needs to know that the outbound calling data they are viewing is accurate and secure data.
  3. Usable – This data must be organized to be quickly accessible and easy to understand.
  4. Delightful – This is the key piece that Walter focuses on, and the piece that sets MailChimp apart from its competitors. Delightful software must appeal to the user on an emotional level, and produce an insightful and memorable experience.

Different members of Century Interactive’s dev team focus on different tiers of this pyramid within our products, and so I am going to kick of a short mini-series written by our different team members, focusing on how we strive to improve our functionality, reliability, usability, and delightfulness.

Here are the links to the posts for each topic: